Draw an area.
Get a CAD-ready base map —
with the buildings counted.
Real streets and their names, blocks, plots and buildings — each on its own layer, ready to open in AutoCAD or QGIS. Delivered as a DXF, minutes after you draw the area.
Built for fibre-optic (FTTH) network design, and just as useful for land subdivision, urban planning and mapping.
Who it is for
The same base map — blocks, plots, real streets and annotations — serves several trades. You get a clean DXF, layer by layer, reusable in your own tools.
Telecoms & FTTH
Area breakdown ready for a fibre rollout: blocks, plots and dwellings per building, with real named streets to route your cables along.
Land subdivision & surveyors
A regular plot layout laid on the true footprint of the area, to prepare, check or present a subdivision project.
Urban planning
A clear base of the area — buildings, streets, open ground — for planning studies, master plans and presentations.
Mapping & GIS
Clean georeferenced layers (UTM, any zone) exported as DXF, usable straight away in AutoCAD, QGIS or your own GIS.
What is in the file
One DXF, layer by layer, reusable in your own tools. No account needed on anyone else's platform, nothing to install.
Streets, as they really are
The existing street network and street names, reported as surveyed — not a grid drawn on top of your neighbourhood.
Blocks and plots
Blocks and individual plots on separate layers, with a setback strip between the road and the block, so the drawing holds up at working scale.
Buildings — and the dwellings
Each building typed and counted: villa, shared compound, R+1, R+2. This is the number you have to settle before sizing any fibre network, and it is the one nobody else hands you.
Where it works
Anywhere in the world the neighbourhood is on the map. You draw the area on a world map, type coordinates, or upload a .kmz boundary exported from Google Earth. There is no country list, no waiting list and no national coordinate system to match. The examples below happen to be African because that is where the work came from first — the engine does not know the difference.
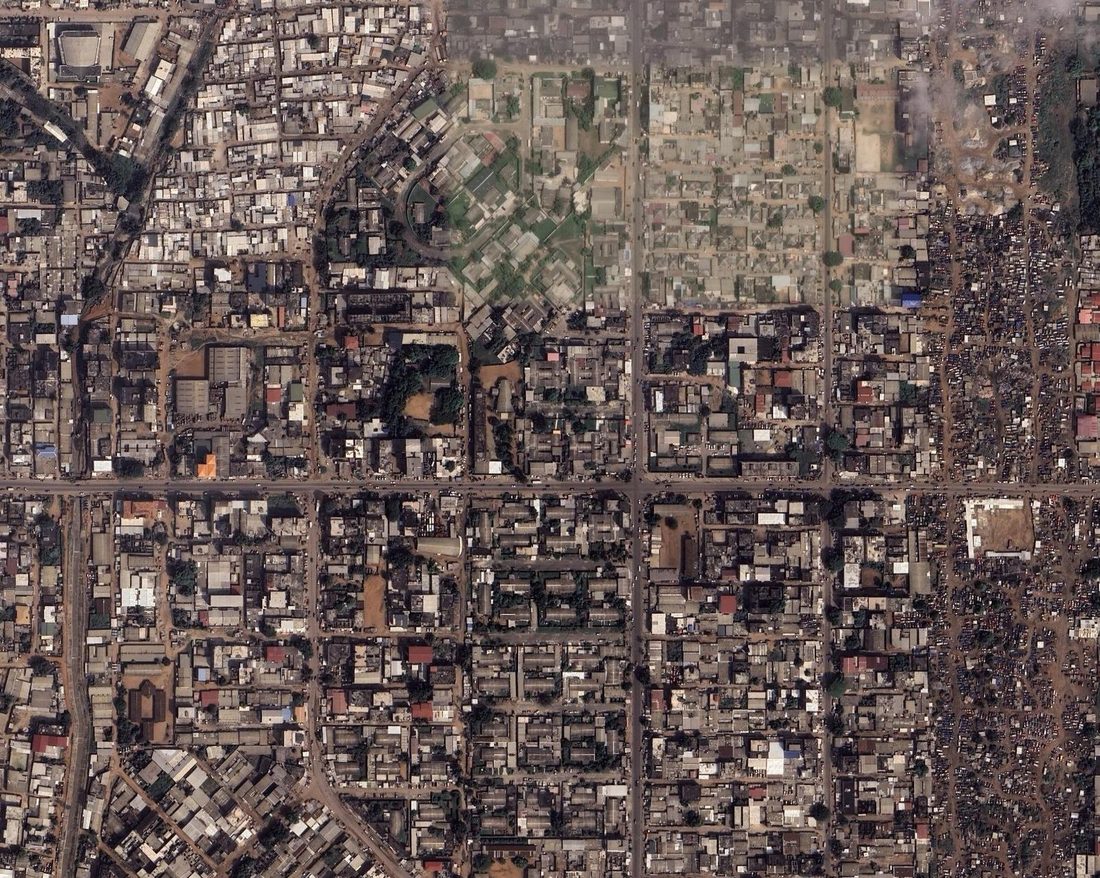
Before / After — on real areas
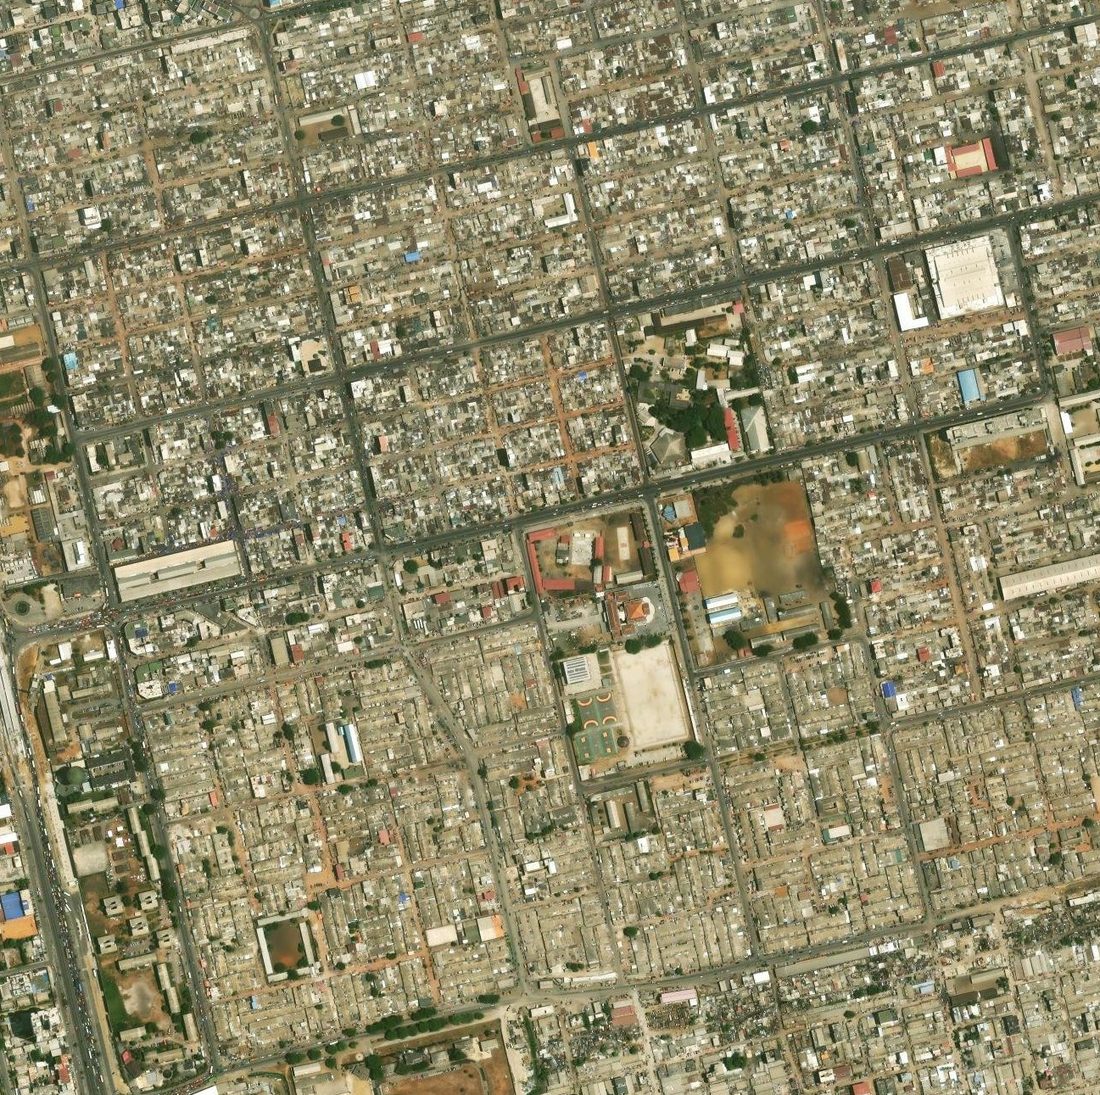
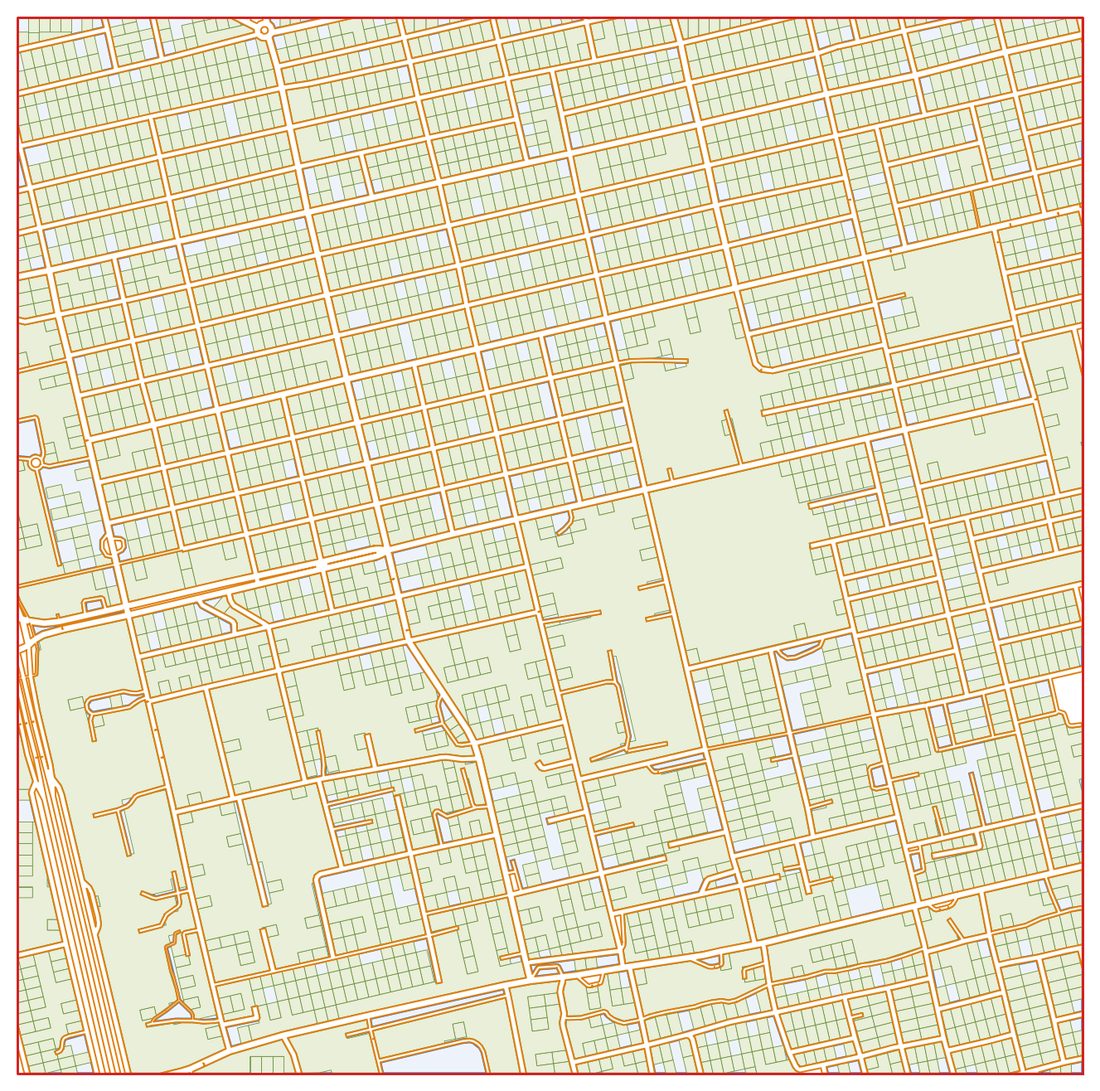
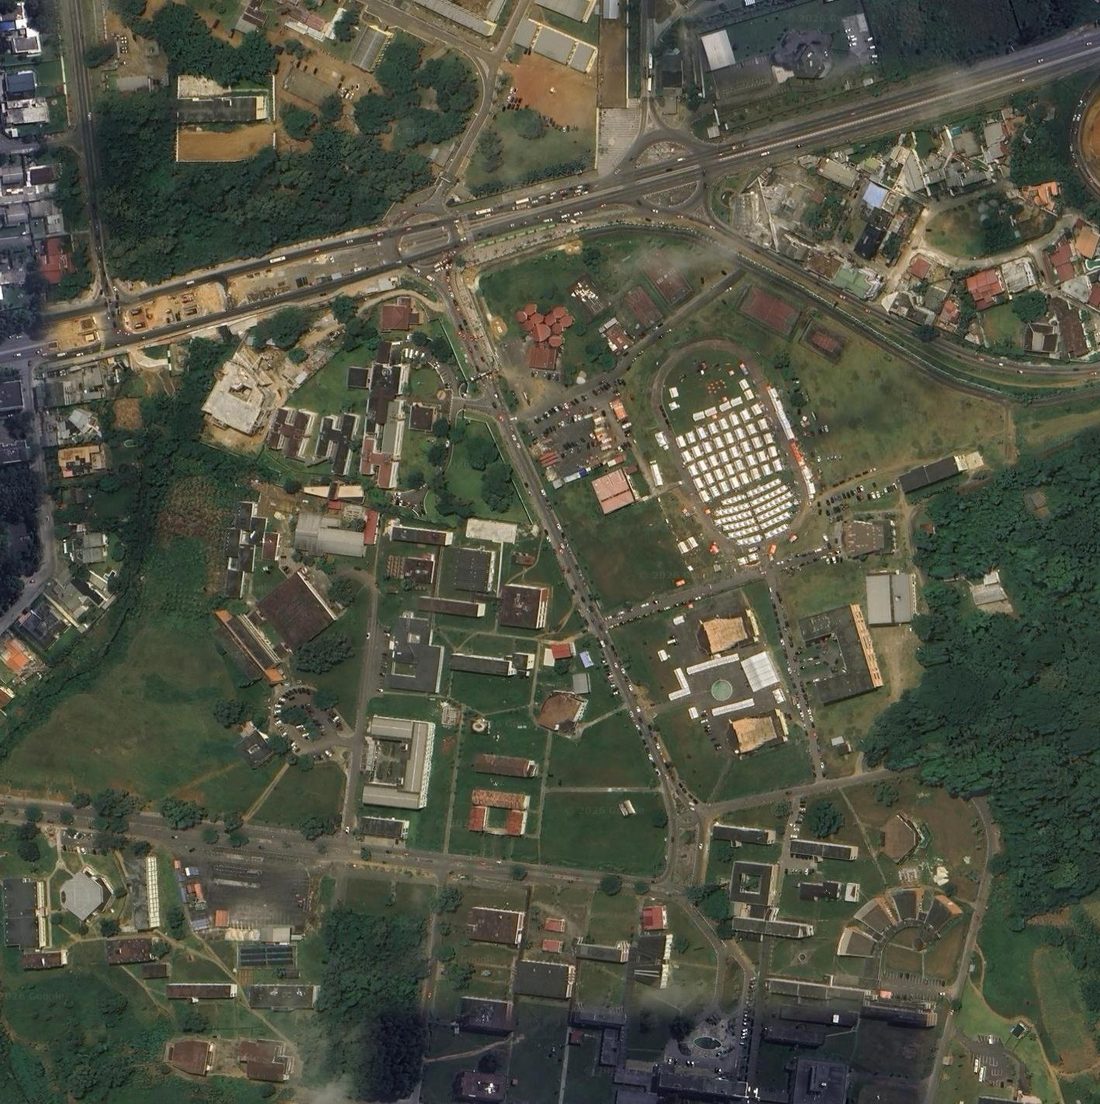
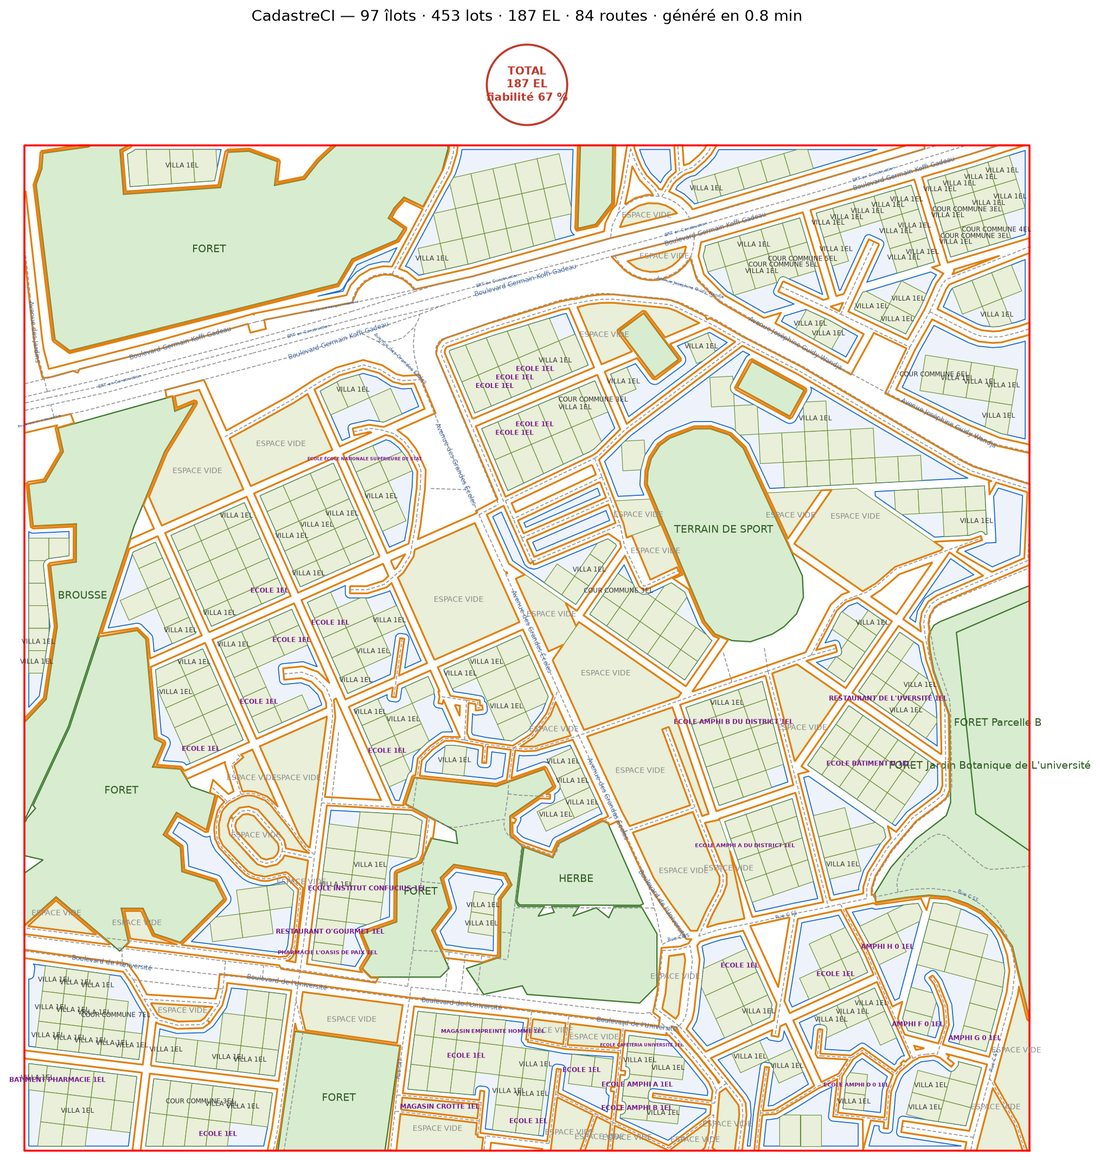
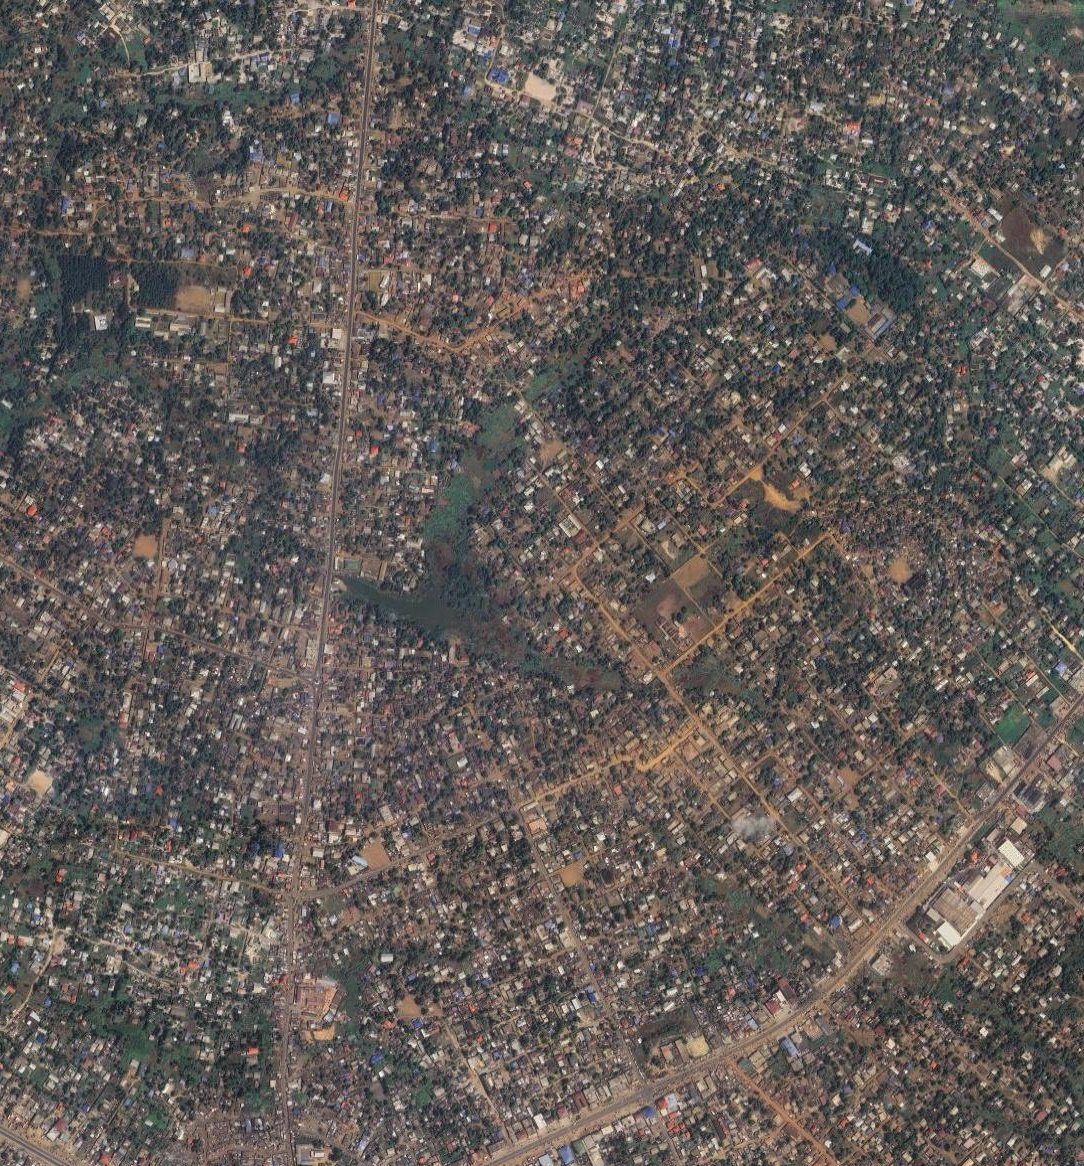
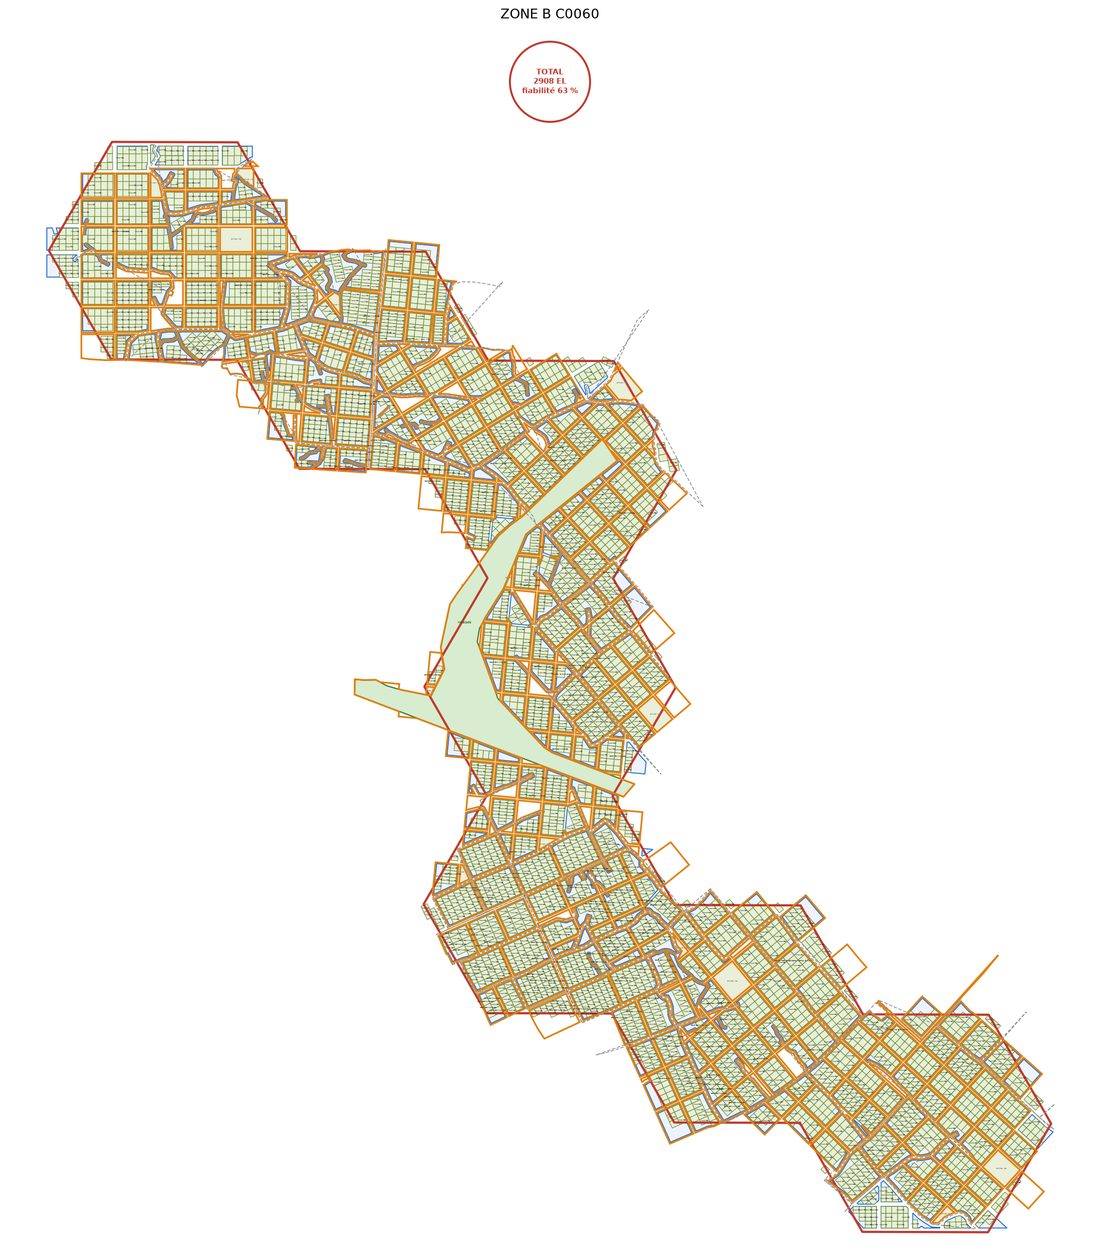
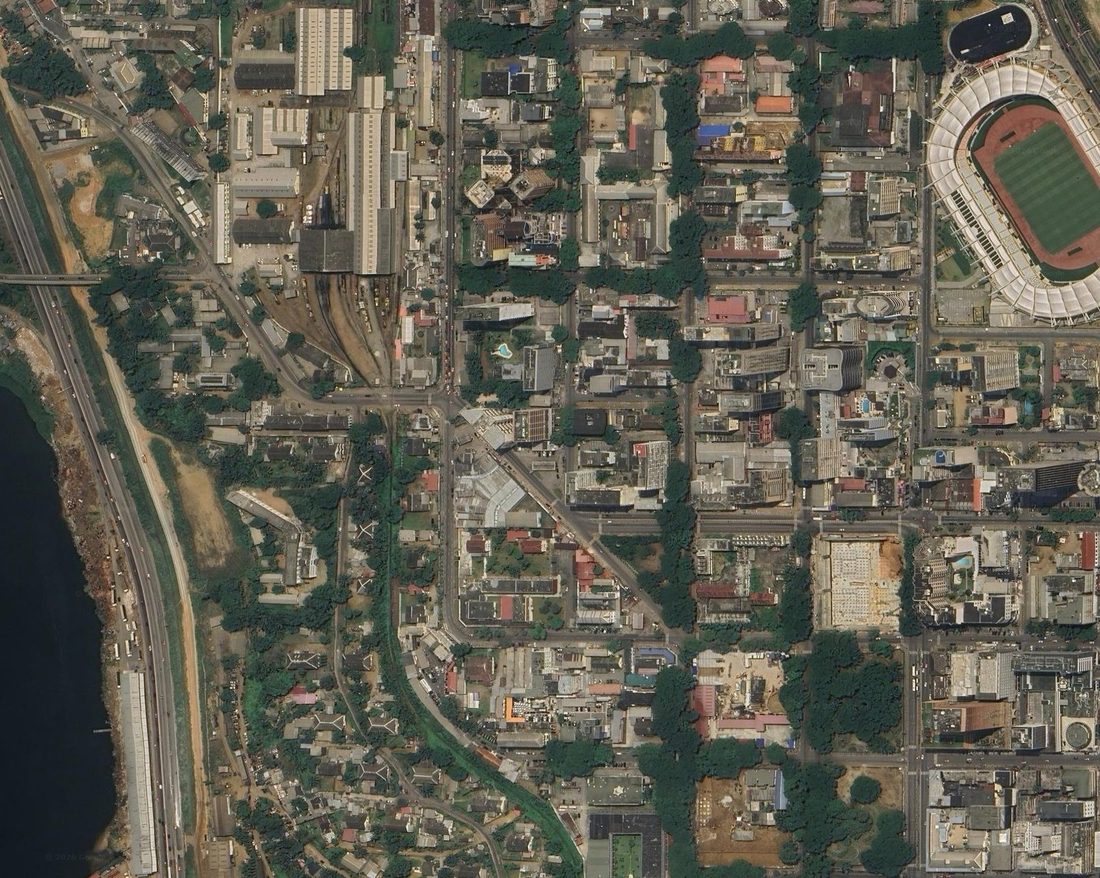
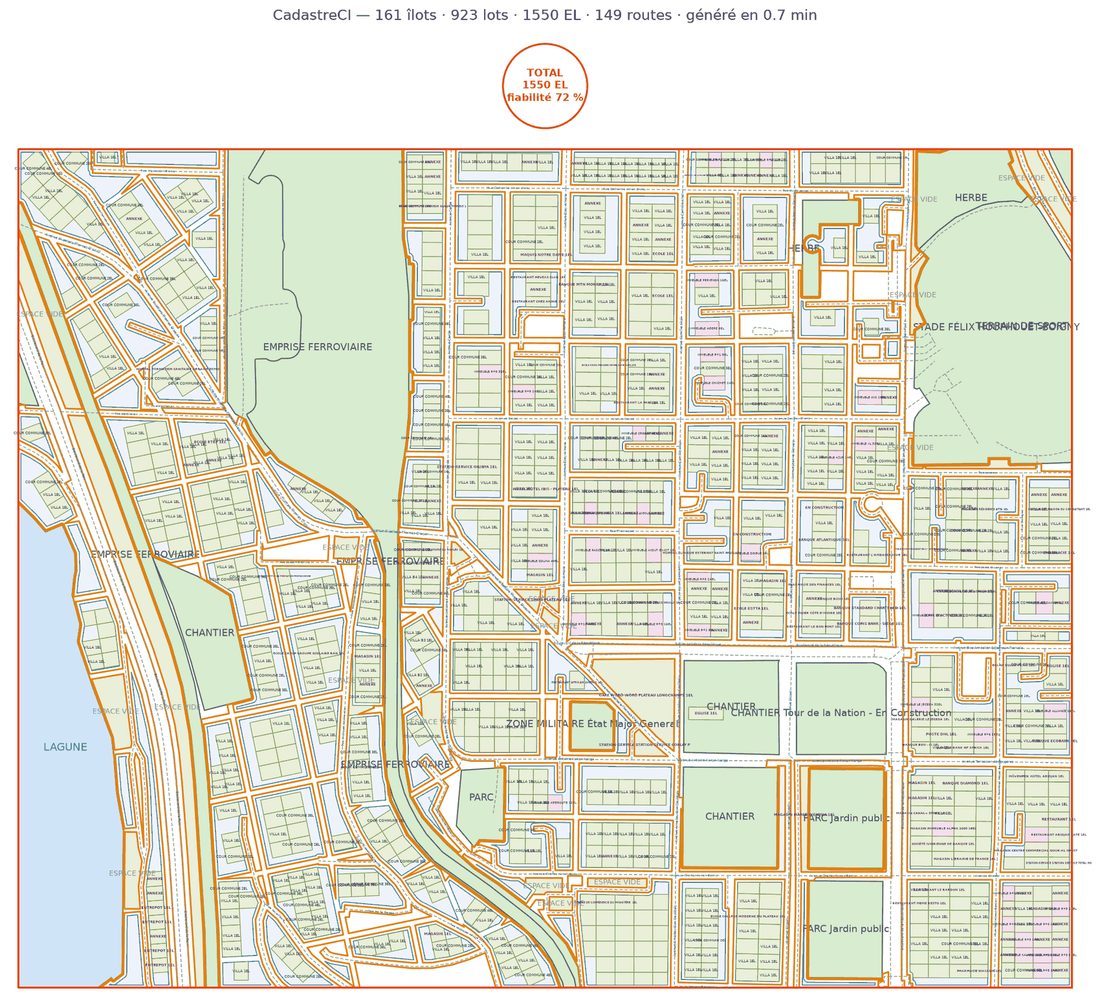
Left: the actual satellite image of
the area. Right: the base map produced by CadastreCI, untouched.
Streets, buildings and shops come from OpenStreetMap, queried
live on every run: a street mapped yesterday shows up in your
file today. The satellite backdrop is the latest image published by
Google over the area.
Area 1 — large urban area (~230 ha, 3,500 plots)
Area 2 — Cocody, Abidjan: housing and a university campus
Area 3 — a .kmz boundary (Monrovia, Liberia): the map follows your EXACT shape
Area 4 — Plateau, Abidjan: it recognises what cannot be lived in
Area 5 — Yopougon, Abidjan: a very dense district, counted building by building
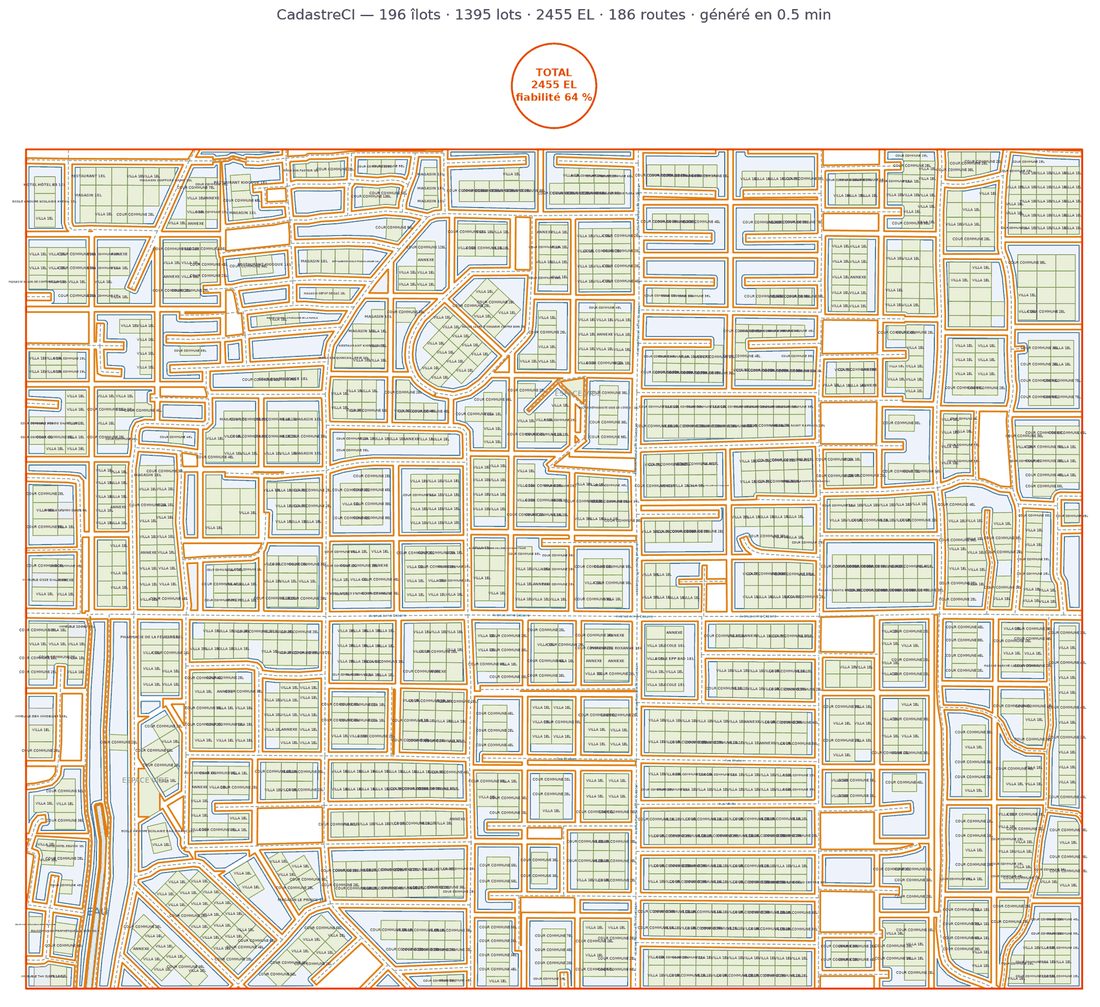
In the delivered DXF, every element sits on its own layer — FRAME, ROADS, BLOCKS, PLOTS, BUILDINGS, WATER and ANNOTATIONS — ready to work with in AutoCAD, layer by layer.
How it works
Draw the area
Search a place name, drop coordinates, or upload a .dxf or .kmz boundary. Any shape — you are not limited to a rectangle.
Let it run
Around two minutes for a 49-hectare area. Large areas are split and reassembled into a single file.
Download the DXF
A DXF with clean layers, a PNG preview, and a quality score out of 100 on the drawing itself — so you know what you are handing over.
Simple pricing
Prices are in CFA francs (XOF), the currency of the eight-country West African monetary union. The euro figure is the fixed parity.
FREE
- 2 maps a day
- Areas up to 2 km²
- Every generation feature
- DXF + preview + quality score
ONE PROJECT no subscription
- One area up to 108 km² — the largest on the site
- No subscription, no monthly charge
- No expiry date — use it when your project comes
- Invoice in your name, for your accounts
ULTRA for companies
- 20 maps a day
- Up to 108 km² per map
- Your whole team on one account
- Priority in the queue
The engine is exactly the same on every plan — a base map that is right has to be right for everyone. What changes is the area size and how many you can run per day.
What this is not
CadastreCI is not a signed document. It is not a title, and it does not replace a licensed surveyor's work. It is the base map you start from — produced in minutes instead of days of drafting.
Streets, street names, schools, banks and other landmarks are existing survey data, reported as they are. Villas and shared compounds are estimates, and that is written on the drawing itself, next to the count. We would rather you know which number is measured and which one is estimated.
Data and licences
Streets, buildings and places come from OpenStreetMap, under the ODbL licence. Additional building footprints come from VIDA (Google Open Buildings + Microsoft), under CC BY 4.0. Every file we deliver carries these credits on the drawing, on their own layer — so the plan says where its data comes from even after it leaves us.
Try it on your own area
2 areas a day, free. Draw a neighbourhood you know and judge the file on your own ground.
Create an account